How Race to Dutch First is built and run
A site that follows the Dutch-speaking World of Warcraft guilds racing to Cutting Edge. It grew out of my stream overlay, and runs on my homelab.
In this post 15 sections
Race to Dutch First follows the Dutch-speaking World of Warcraft guilds trying to be the first to Cutting Edge: the achievement for killing the last boss of the raid tier on Mythic, the hardest difficulty, before the next tier opens. A pull is one attempt at a boss, and a guild’s best pull is the one that got the boss’s health lowest. The site shows every guild’s kills, how far each one has brought its current boss, who is raiding and streaming right now, and the order the guilds killed each boss in. It’s in Dutch first, with a switch to English.
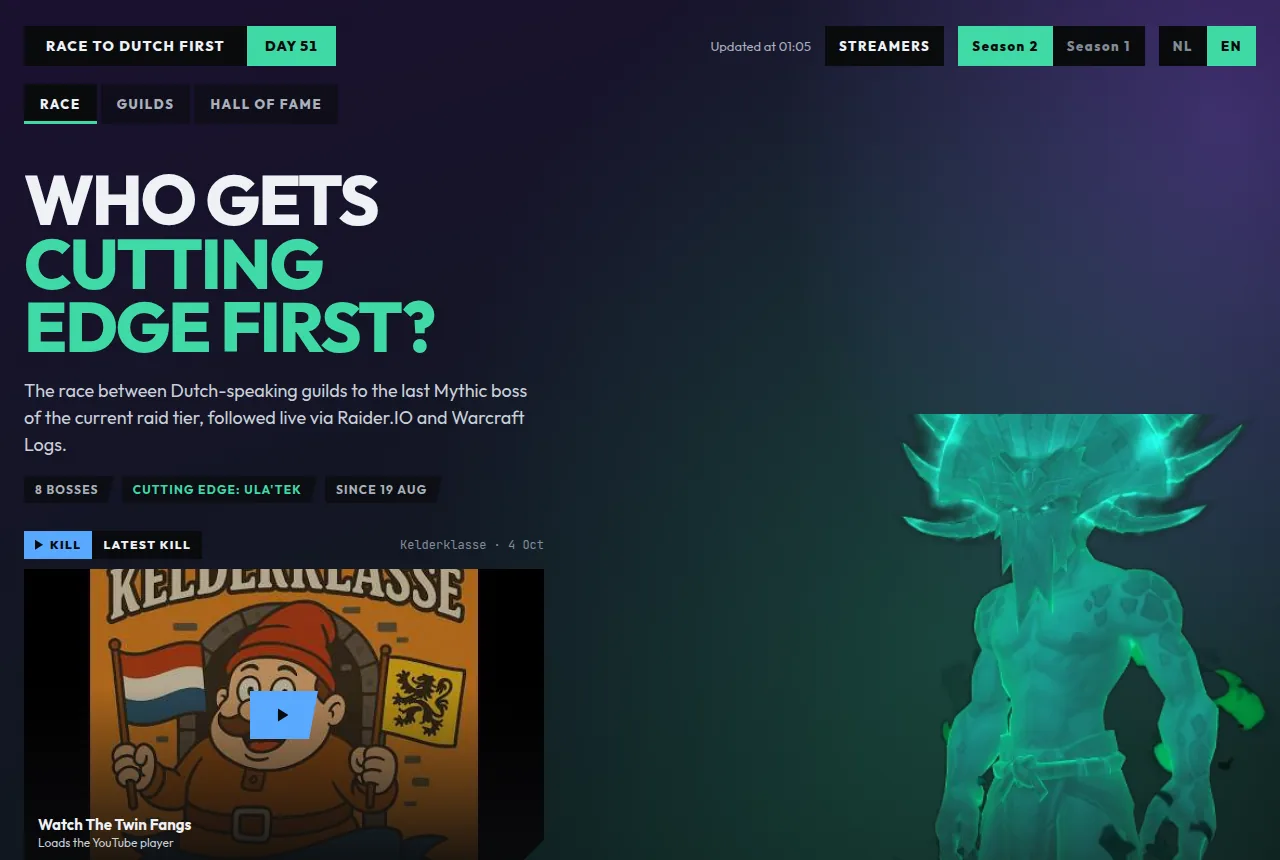
I started it on 2 October. Four days later it ran on my homelab, and by 8 October it had 83 merged pull requests. Most of the code was the easy part. The work went into data from two sources that rarely agree, and the site ended up on the homelab I run through pull requests, which already had nearly everything it needed.
Where it started
It started with the overlay I use when I stream my raids on Twitch. That overlay already read Raider.IO for my own guild, Kelderklasse, which is one of the guilds in this race. It knew our characters and boss kills, and it had a look of its own: dark panels, slanted ribbons, a few strong colours. With that much in place, I started wondering what I could actually show with it. The answer became every Dutch-speaking guild in the race, side by side.
The first attempt was an experiment. I was trying out Paperclip, a harness that runs a small team of agents on GitHub issues, partly with a local model, and it was taking ages. The version it produced had the right shape and the wrong numbers: one guild showed three kills when it had two.
So I switched to Claude Code and rebuilt it the same day, with a fix and a test for every problem in that first version. The rebuild had 34 tests. It has over 150 test functions now, and none of them touch the network.
What it shows
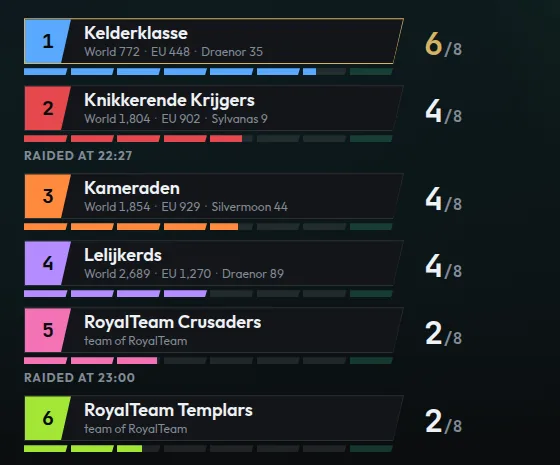
The Race view is the question on a poster. Every guild gets a ribbon with its kills, a bar for how far it is through the raid, and its world, region and realm rank. A guild that pulled in the last hour gets a “raiding now” badge. While someone listed is streaming, the hero gets a Twitch player, and off air it plays the latest kill.
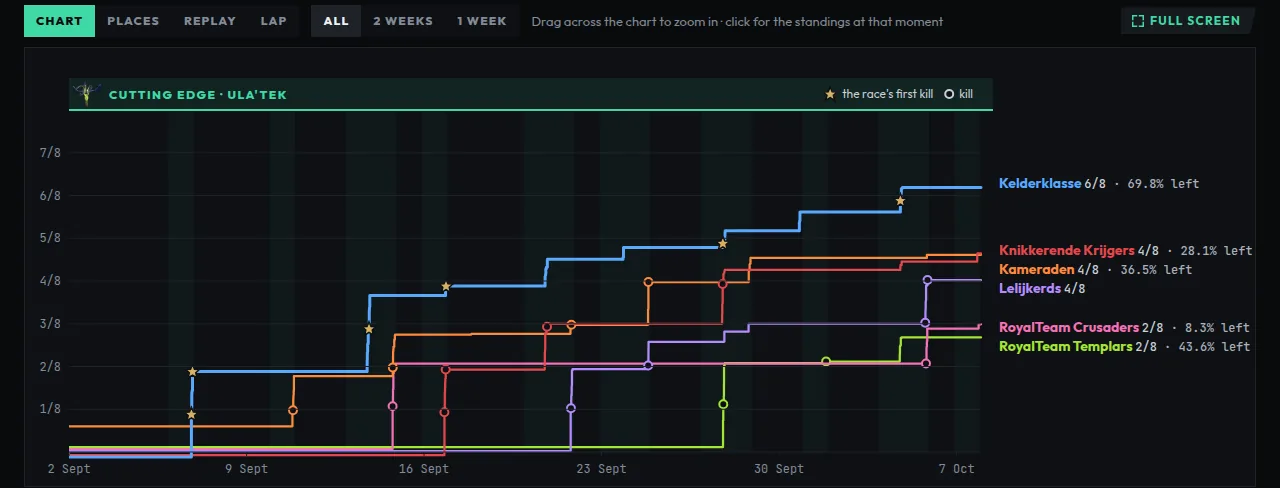
Progress draws every guild’s race position over time, in four views of the same moment: a chart you can zoom, a bump chart of the places, a replay on the board’s race track, and a lap of an athletics track. Below it, the race log tells the race as it happened, newest day first.
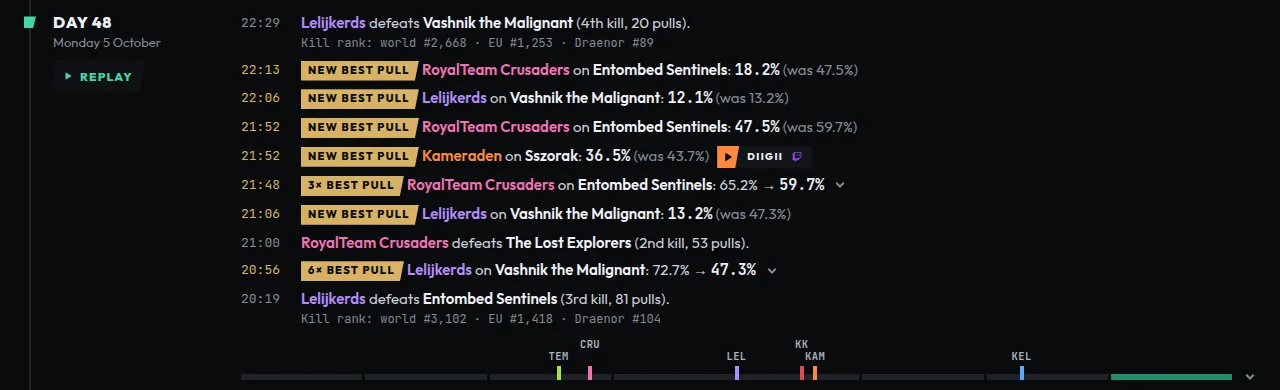
Overtakes come from sampling every guild’s position every three hours. The Replay button plays a day’s kills and runs again as the cards that interrupt the hero when a refresh brings news: a percentage counting down for a new best, BOSS DOWN for a kill.
The Guilds view gives every guild a row of its bosses, and the hall of fame shows who was in each kill, as a raid frame (the grid of player boxes from the game) in class colours.
Raider.IO first, Warcraft Logs for the gaps
Raider.IO has a public API without a key. Its terms allow only the published endpoints and ask for a link back. The fetcher keeps to that: it waits 0.3 seconds before every request, sends a User-Agent that names the site, and retries twice before it gives up. A failed run writes nothing, and the site keeps the last good data instead of a page of zeros.
Warcraft Logs has every pull a guild logged, which Raider.IO’s live tracking sometimes misses. Twitch, through DecAPI, tells the page who is streaming, and the kill videos come from YouTube and Twitch, further down.
A guild’s race position is its Mythic kills plus how far it has brought its current boss, so 6 kills and a best pull at 30% is 6.7. Ties go to the lowest best pull, then to the guild whose latest kill came first. The winner is whoever kills the Cutting Edge boss first, whatever the ranking says.
Merging the two sources happens per boss: the earliest kill from either, the most pulls up to that kill, and the lowest best pull. Warcraft Logs never simply wins, because its logs have gaps of their own.
What the live data got wrong
Each of these turned up in the live data during the first week, and each one has a test now.
Kill order isn’t linear. RoyalTeam and Lelijkerds had two kills each with boss 2 still alive, so kills can’t be counted from the boss order.
Live tracking misses kills. Lelijkerds killed The Lost Explorers on 24 September, and a week later Raider.IO’s progress endpoint still had the boss alive at 8.57%. The kill endpoint decides what is dead. Live tracking only supplies the pull counts and the best pull.
A missing kill isn’t an error. Raider.IO’s kill endpoint answers a boss that isn’t dead with an empty object and HTTP 200.
The same evening gets logged twice. Several raiders log the same raid to Warcraft Logs. Kameraden had 107 of its 259 fights in there twice. Copies start within five seconds of each other and the next real pull is at least 80 seconds later, so fights of the same boss less than ten seconds apart count once.
Logs are incomplete, and sometimes somewhere else. RoyalTeam logs no Mythic at all, and Lelijkerds’ first logged Mythic kills came a week after the real ones. Most of their raid logs go to a second Warcraft Logs guild, which I only found when the site showed 4 pulls on a boss they’d pulled 20 times.
One guild is two teams. RoyalTeam raids as two teams, each with its own Warcraft Logs guild, while Raider.IO only knows the guild as a whole. Each team now gets its bosses from its own logs, and a kill roster from Raider.IO goes to the team whose logged kill happened within 20 minutes of it.
Kill ranks from fifty pages of rankings
Raider.IO’s own site shows how many guilds in the world killed a boss before yours. No published endpoint gives that number per guild. The published world ranking does list every guild with its first kill per boss, 100 guilds a page, so the fetcher reads about fifty pages and counts.
That costs about 30 seconds, so it doesn’t run every time. It scans at most once an hour, only while a kill is less than three days old, because Raider.IO keeps adding guilds that killed a boss earlier. It stops after three minutes and keeps the ranks it had. Before I showed the numbers, I checked them against Raider.IO’s own pages.
Kill videos and Twitch VODs
Raider.IO shows kill videos on its own pages, but no published endpoint gives their link. So the videos come from the guilds themselves.
A guild with a YouTube channel lists it in the config. YouTube publishes every channel’s latest 15 uploads as an RSS feed, which needs no key, and the fetcher reads it after each run. A killed boss gets the earliest upload whose title names it and that went up after the kill, within 30 days. The match ignores case, accents, punctuation and “the”, so “Kelderklasse vs Twin Fangs Mythic” counts for The Twin Fangs, and a one-word name before an epithet is enough. Older uploads fall out of the feed, so a match carries over from the previous run.
Twitch keeps past broadcasts, called VODs, and one kill can have several of them: on The Twin Fangs, bmiest and rughaar both streamed the kill. The live check uses DecAPI, but DecAPI doesn’t know when a past broadcast started, so the VODs come from Twitch’s own API with an app token: one request per channel for its last 100 broadcasts. A broadcast that ran at the moment of a guild’s kill pull becomes a link that opens at that exact second. That moment is Raider.IO’s kill time, or the start of the kill fight in Warcraft Logs when that is earlier.
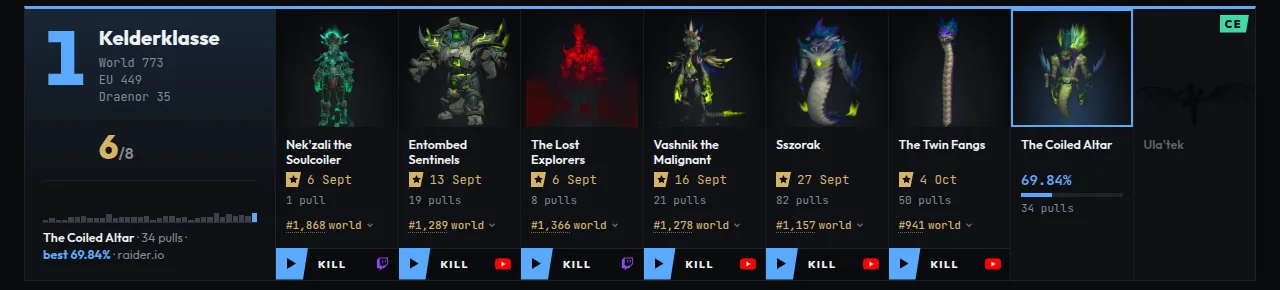
New best pulls get VODs too, without storing a link per pull. Each guild keeps the time windows of its streamers’ broadcasts that overlapped one of its best pulls, and the page works out which streams were live at any given pull. Twitch deletes past broadcasts after 7 to 60 days, depending on the account, so a VOD stays only while its channel still lists it.
Wherever there’s room for one link, the YouTube upload wins. The race log and the hall of fame show every point of view.

Both players load only after a click. Before that, the page shows a still from YouTube or Twitch, so a visitor who doesn’t press play never loads either player.
Guild names are hostile input
The page is plain HTML, CSS and JavaScript. It has no framework, no frontend build step and no scripts from a CDN. It loads race.json and draws everything from it, the charts included, as inline SVG. A small Python step puts the standings into the HTML as well, so search engines and link previews see them.
Guild and boss names come from someone else’s API, so the page treats them as hostile. Nothing uses innerHTML, and the Content Security Policy allows the site itself and a few named hosts, with no inline scripts or styles. A guild named <img onerror=…> shows up as text. A test fails the build on any innerHTML. Another fails on any string that exists in Dutch but not in English.
The feedback form in the footer is the only place strangers can send something in, so its endpoint is stricter still. It takes JSON only, from the site’s own origin, at most 8 KB, with known fields of capped length. It rate-limits per visitor under a keyed hash, so it never stores an IP address, and it blocks every mention in the Discord message it sends me. A hidden honeypot field and Cloudflare Turnstile keep most bots out.
My stream overlay, grown into a poster
The look comes from that same overlay. Its colours, fonts and slanted ribbons now live in a design repository that the overlay, this site and a gear dashboard share. The site turns it into a raid poster: the boss the leader is stuck on is the hero, and the standings hang over it like the overlay’s ribbons.
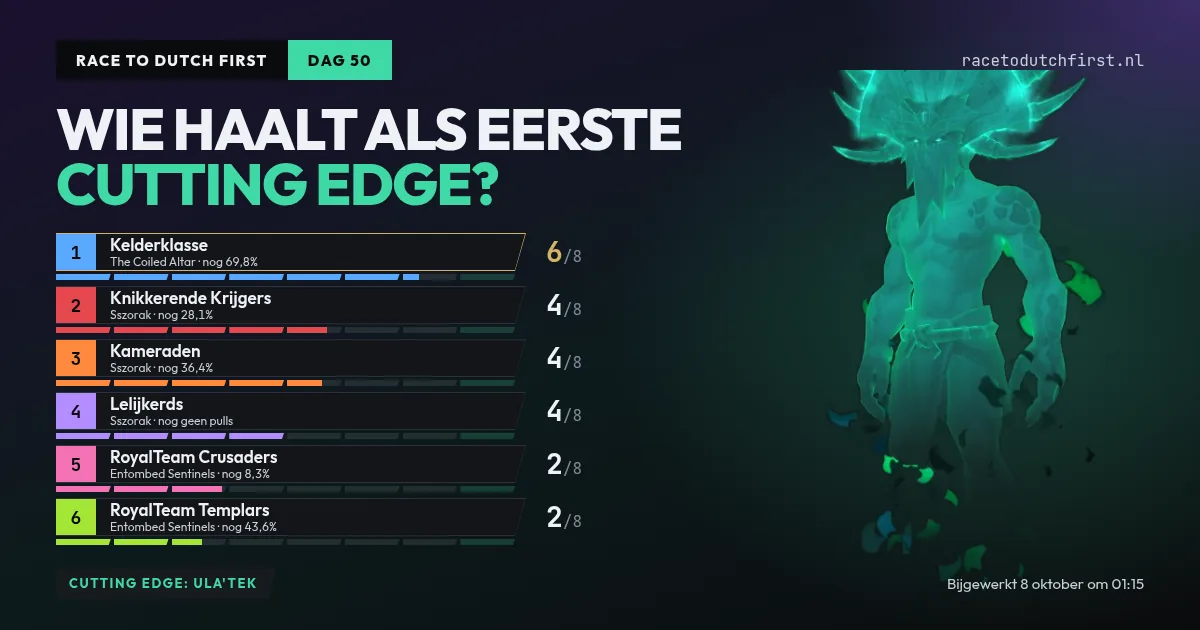
For the design I use Impeccable, a plugin with design skills for Claude Code. The mockups changed how I work. For anything bigger than a tweak it builds two to four variants in real HTML with the real data, and I pick one. The hall of fame had four candidates and the kill videos three. The choice goes into the docs with its date, so a later session doesn’t undo it. Impeccable also flags the usual AI design habits, like a coloured stripe down the side of every card, and it ends a build with a review against the chosen mockup.
The CLAUDE.md remembers
Claude Code writes almost all of the code. I decide what gets built and how it should look, and I read every pull request before it merges.
The CLAUDE.md in the repository makes that work. Claude Code reads it at the start of every session, and it has become the project’s memory: the race rules, every data trap with the date it was found, the security rules, and the reason behind each design choice. When a session learns something, writing it down is part of the job, so the next session doesn’t make the same mistake.
Tested on real data, with a changelog
The tests replay real API responses. The fetcher can record what the APIs answer into fixtures, trimmed to the fields the code reads, and the tests run a real season without the network. The real page gets checked too, in headless Chrome at phone width and at 1280 pixels. A chart can pass every test and still draw at a negative size in a hidden tab, which only the real page shows.
The pull requests stay small, one change each, and each goes through linting, tests and an image build before I merge it. Every build on main gets a version, v<date>.<n>, shown in the site’s footer. Every change a visitor would notice also gets a line in Dutch and English in a changelog file, and the site turns that into its own changelog page.
GitHub skipped the raid evenings
The first version ran on GitHub Pages, with a scheduled workflow fetching new data. On raid evenings that failed. GitHub starts scheduled runs late or skips them: on 4 October 5 of 24 planned runs went, and on 5 October one of about 20.
On 6 October the site moved to my homelab. The repository now builds a container image that runs its own schedule: every five minutes on raid evenings, hourly the rest of the week. Raider.IO caches its answers for four minutes, so fetching more often gains nothing.
The fetch container and nginx share one folder. The fetcher writes every file under a temporary name and renames it into place, so nginx never serves half a file and a failed run leaves the last good one alone. Once an hour, if the data changed, the same container starts Chromium and redraws the image Discord shows when someone shares the link.
The homelab already had the rest
Moving the site took a day, because senate, the repository that runs my homelab, already did everything around it. Visitors come in through the same Cloudflare tunnel as this blog, so I opened no ports. Renovate already deployed this blog by bumping a pinned image digest, and the site got one rule to do the same. The Warcraft Logs and Twitch credentials went into senate’s encrypted secrets.
The containers got the hardening every stack in senate gets: a read-only filesystem, all capabilities dropped, a memory limit, and a healthcheck on a heartbeat file the fetch loop writes every minute. The images build on a runner in the homelab instead of on GitHub’s, which keeps Docker’s layer cache and costs no Actions minutes, now that the repository is private.
What it costs to run
Prometheus in the homelab scrapes every container through cAdvisor every 30 seconds, so the site’s footprint was already being measured before I thought to look. The numbers below are for Wednesday 7 October, a raid evening, when the fetcher ran every five minutes from 19:00 to 01:00 Brussels time and hourly the rest of the day.
| Container | Memory, average | Memory, peak | Limit | CPU that day |
|---|---|---|---|---|
| fetch | 43 MiB | 145 MiB | 768 MiB | 205 s |
| web | 6 MiB | 9 MiB | 64 MiB | 57 s |
| feedback | 25 MiB | 49 MiB | 96 MiB | 218 s |
All three together used about eight minutes of CPU time in 24 hours. They share docker-web-1, a VM with two virtual CPUs and 2.9 GiB of memory, with this blog, the Umami analytics and a few WordPress sites, and over the 48 hours before I wrote this, that VM was busy 2.6% of the time.
The fetcher spends nearly all of a run waiting. It pauses 0.3 seconds before every Raider.IO request, so a run of about 85 seconds stays under a few percent of one CPU. Its memory jumps when it starts Chromium for the share image: the highest point over those two days was 287 MiB, on the 6th. That’s why its limit is 768 MiB while the other two get less than 100.
The surprise was the feedback container. It does nothing but wait for the feedback form, yet it used more CPU than the fetcher, and 134 seconds even on the quiet Tuesday before. Its healthcheck starts a new Python interpreter every minute to ask the endpoint whether it’s up, so that’s 1,440 interpreter starts a day doing almost nothing.
Those same 24 hours were the busiest so far. Umami counted 574 unique visitors, 646 visits and 1,440 page views; switching between the Race, Guilds and Hall of fame views counts as a page view. A visit lasted about two minutes on average, and a little over half of them saw only one view. Most people came in the afternoon, about 265 between 14:00 and 16:00 Brussels time, after I posted the site on r/wow, and the raid evening from 19:00 to 01:00 brought another 587 page views. Umami has only counted since 5 October, and until 7 October it missed everyone outside Belgium, so the days before don’t compare.
Traffic runs the other way from what I expected. On that Wednesday the fetcher downloaded 372 MiB from Raider.IO, Warcraft Logs, Twitch and YouTube, and nginx sent 227 MiB to those visitors. Cloudflare serves the scripts, fonts and images from its cache, so nginx mostly answers for race.json and the page itself.
Next: an agent that maintains it
Paperclip didn’t stay. After a trial next to it, on 6 October I kept OpenHands, which drives the same Claude Code from a VM in the homelab. It works on GitHub as a separate bot account that can read the repositories, comment, and open pull requests from its own fork. It can’t merge or start a workflow, and the checks on its pull requests only run after I approve them. The VM reaches the internet, but not my home network apart from one local model server.
So far I hand it work myself. The next step is a scheduled automation that picks up one issue a day that I’ve labelled for it and opens a pull request. The bot can’t set labels, so my label is the permission: nobody else can put work in its queue. After that, it could comment a first diagnosis on the issues that senate’s nightly drift checks open, and summarise the release notes on the Renovate pull requests that don’t merge themselves.
This site already has a candidate. The second Warcraft Logs guild I found for Lelijkerds turns out to be one of two raid teams, like RoyalTeam’s, and they should race as teams. That’s a few lines of configuration and a test, the size of job an agent should be able to finish on its own.
What isn’t solved yet
- The site depends on Raider.IO, which goes down regularly. While it’s down the page shows the last good data with its fetch time.
- A team that doesn’t log a kill to Warcraft Logs doesn’t get that kill. Raider.IO can’t tell the teams apart, and there’s no other source.
- The kill ranks are counted from Raider.IO’s ranking pages. If those pages change, a scan fails and the ranks keep their last value.
- Cloudflare Turnstile on the feedback form only went live this week, so real bots haven’t tested it yet.
- None of the OpenHands automations has run unattended yet, so everything in the last section is still untested.
The race itself is still on, at racetodutchfirst.nl.
TL;DR
- Race to Dutch First follows the Dutch-speaking guilds racing to Cutting Edge in World of Warcraft. I started it on 2 October, and four days later it ran on my homelab.
- It grew out of my stream overlay, which already read Raider.IO. A first try with an agent harness and a local model was taking ages, so I built it with Claude Code instead.
- Raider.IO is the base and Warcraft Logs fills its gaps, merged per boss. Kill videos come from each guild's YouTube feed, and Twitch VODs open at the second of the kill pull.
- GitHub skipped most scheduled runs on raid evenings, so a container on my homelab now fetches every five minutes, deployed by the same Renovate pull requests as this blog.
- Next is OpenHands picking up issues I label for it, as a bot account that can open pull requests and nothing else.